R Statistical Language
Install (Ubuntu)
- README
sudo apt install r-base-coreexport R_LIBS_USER=$HOME/opt/R/lib- set the library path for installing libraries
Environment
R- REPL- Make an R Script executable by setting shebang to:
#!/usr/bin/Rscript
Demos
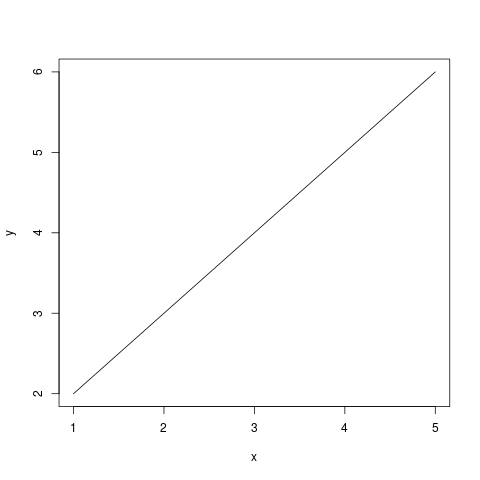
Plotting the x,y content of a CSV file (plotcsv.r)
# small sample that reads data from a CSV file and
# uses 'plot' for creating both a png and a pdf with the data plotted

data <- read.csv("datafile.csv", header = TRUE) # Read from csv file

print(data)             # Print the file contents.
print(data$x)           # Print values for column X
print(data[2])          # Print values for column '2'

png("out/plotcsv.png")  # Specify the png output file name
plot(data, type = "l")  # Plot the values as a line = l

pdf("out/plotcsv.pdf")  # Specify the pdf output file name
plot(data, type = "l")  # Plot the values as a line = l
The output as png (see plotcsv.pdf for the pdf output)
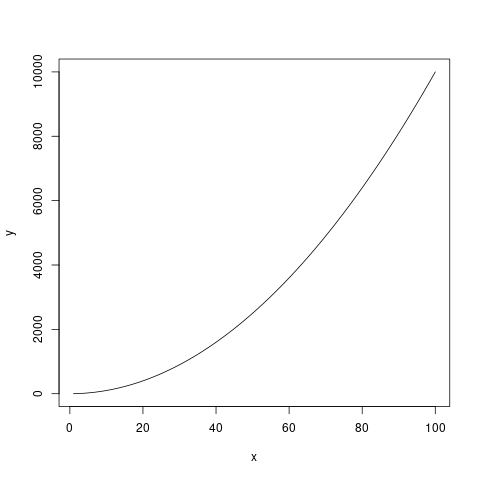
Plotting a formula - x² (plotformula.r)
# small sample plots a formula
# uses 'plot' for creating both a png and a pdf with the data plotted

x <- 1:100                  # Create vector.
y <- x^2                    # Create vector by formula.

png("out/plotformula.png")  # Specify the png output file name
plot(x, y, type = "l")      # Plot the values as a line = l

pdf("out/plotformula.pdf")  # Specify the pdf output file name
plot(x, y, type = "l")      # Plot the values as a line = l
The output as png (see plotformula.pdf for the pdf output)